Analysis
GazooResearch comes complete with a suite of python based analysis tools, because what is the point of collecting data if you can’t analyse it.
Install and Use GazooResearchUtils Package
!pip install GazooResearchUtils
import GazooResearchUtils as gz
import numpy as np
import pandas as pd
Read Data For Analysis
Upload exported data to Dataframe
df = pd.read_csv("./data.csv")
Convert To Human Readable Format
It is recommended to do all the analysis with the default format, and only at the last second, should you convert it to the human readable format.
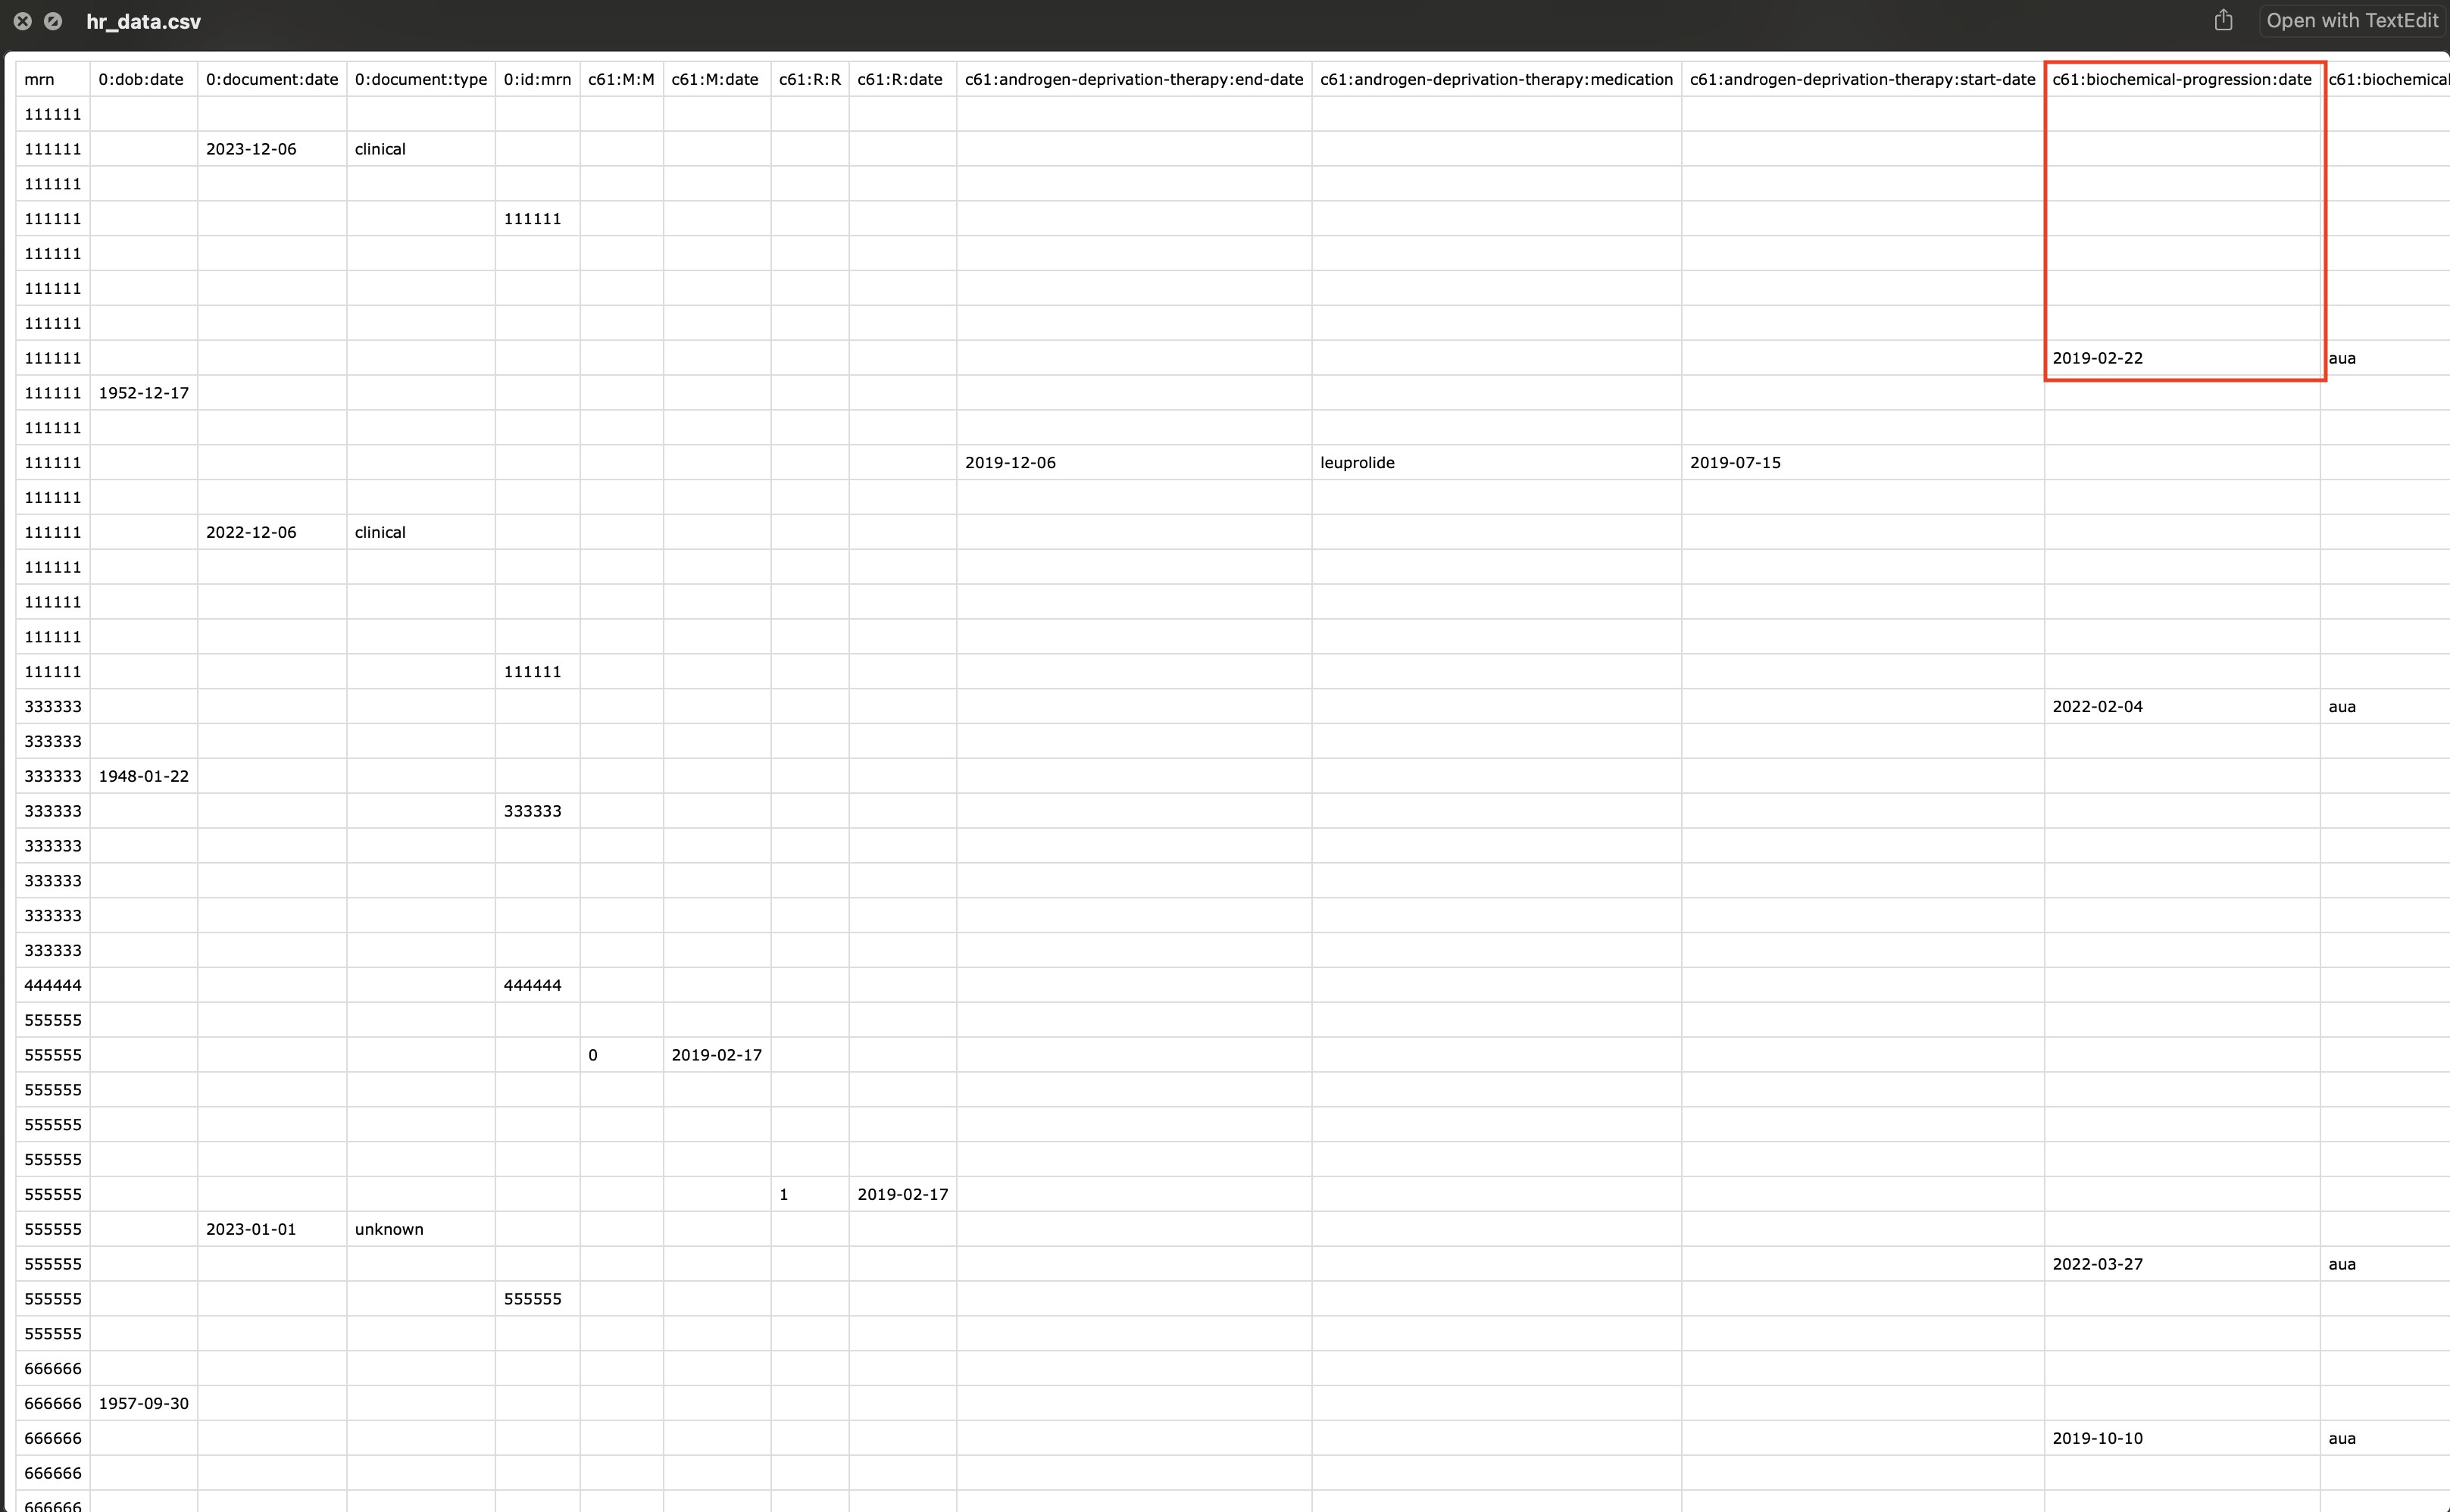
We use the gz.pivot() function to convert denormalize the data into a more human readable format.
# Convert to human readable format
hr_df = gz.pivot(df)
# Save to csv
hr_df.to_csv("/Users/andrewlim/Desktop/hr_data.csv")
Note that now the column names are the data fields. For example, for mrn:111111, the date of biochemical progression is 2019-02-22.
Plot Data
if you want to plot PSA values, this is what you want to do.
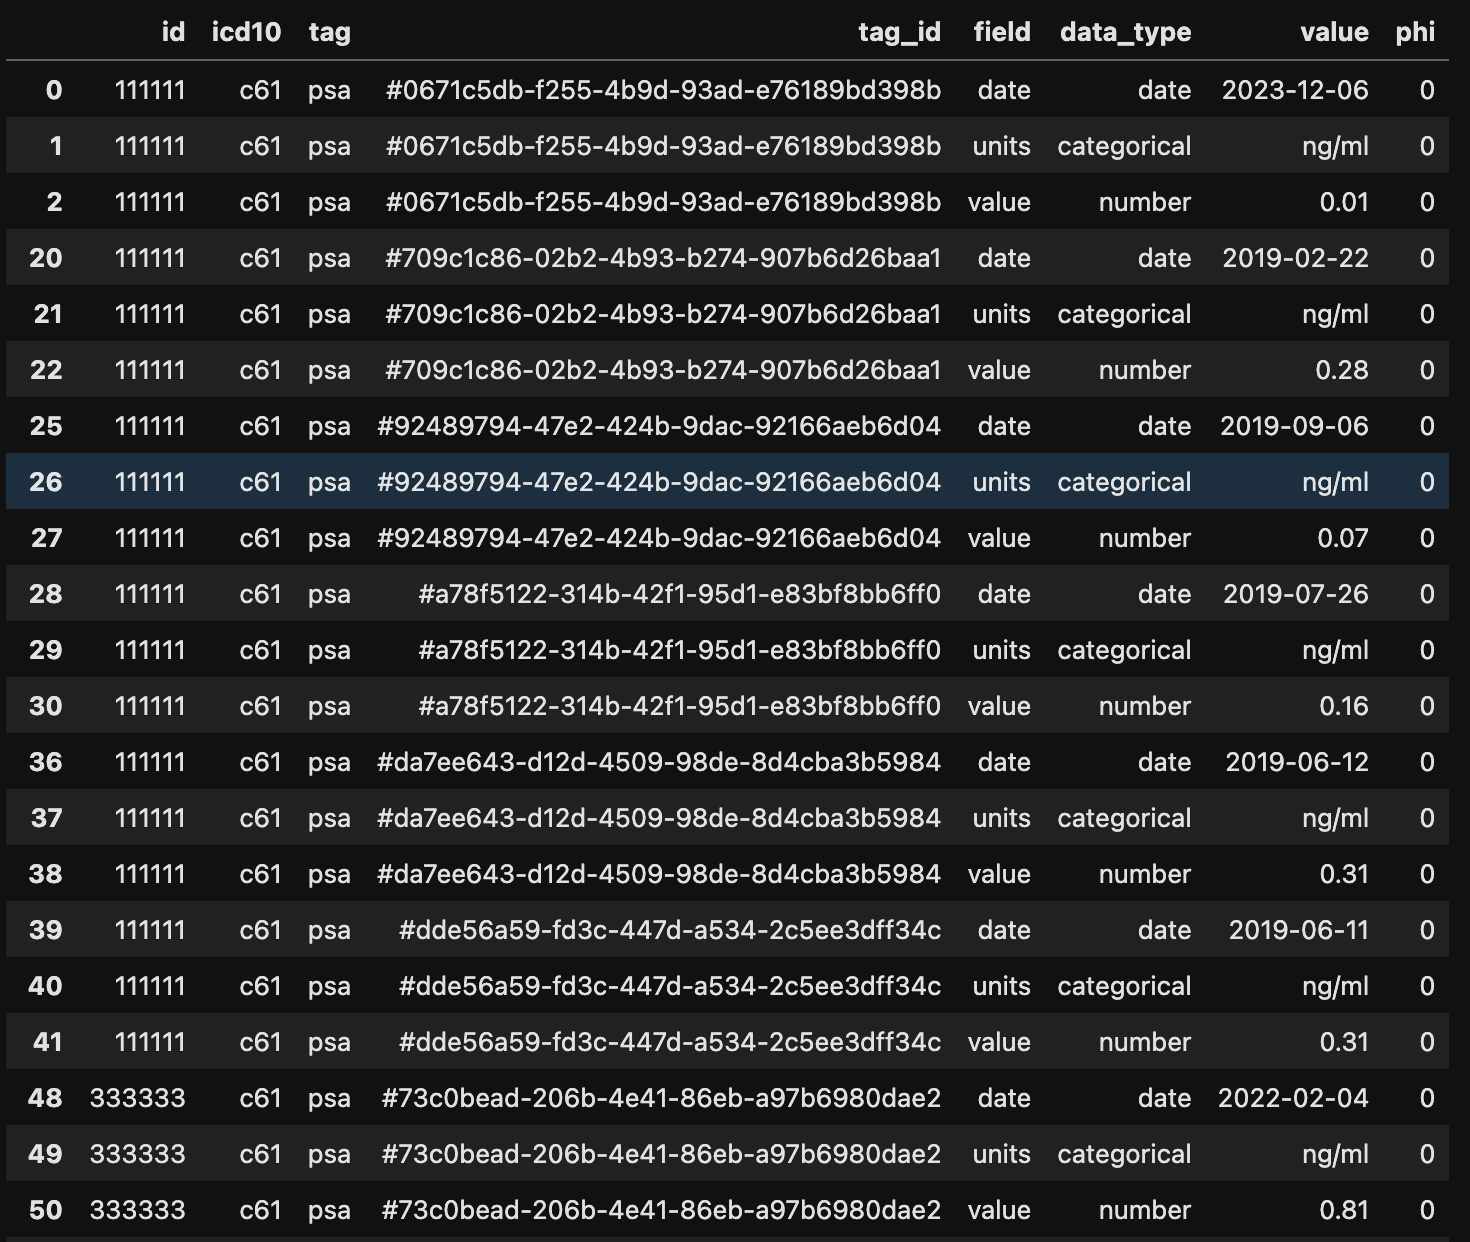
filter = {'tag':'psa'}
gz.get_tags_where_filter(df, filter)
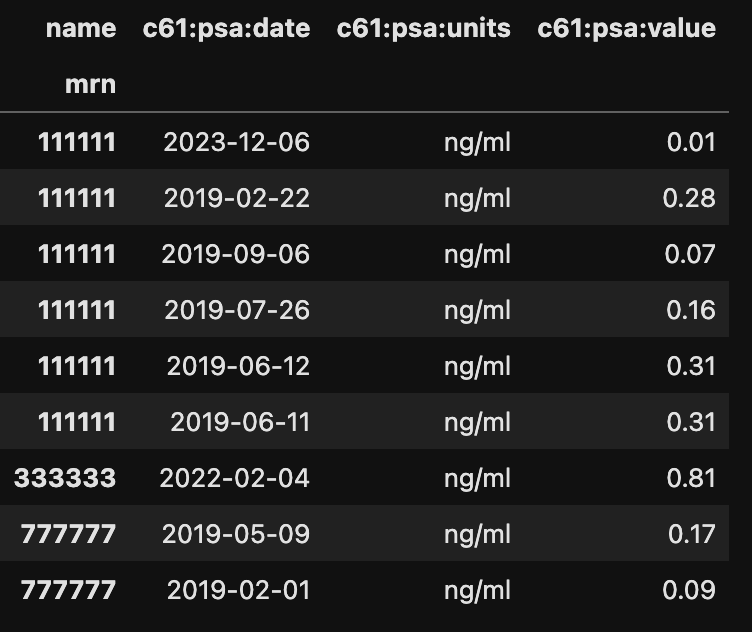
 By simply applying the gz.pivot() function, the data is more readable.
filter = {'tag':'psa'}
psa = gz.get_tags_where_filter(df, filter)
gz.pivot(psa)
I recommend being more verbose when specifying the filter object.
# Filter Object Structrue
{'icd10':str, 'tag': str, 'field': str, 'exact': [str, str,...], 'between': [float, float]}
The below finds all the tags which have the psa valube between 0 and 5.
filter = {'icd10':'c61',
          'tag':'psa',
          'field':'value',
          'between':[0.,5.]}
psa = gz.get_tags_where_filter(df, filter)
gz.pivot(psa)
The below finds all the tags which have the pT:T value of ‘2c’, or ‘3a’, or’3b’.
filter = {'icd10':'c61',
          'tag':'pT',
          'field':'T',
          'exact':['2c','3a','3b']}
t_df = gz.get_tags_where_filter(df, filter)
gz.pivot(t_df)